2016 climate trends continue to break records
Related images
(click to enlarge)
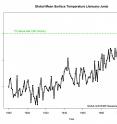
Two key climate change indicators -- global surface temperatures and Arctic sea ice extent -- have broken numerous records through the first half of 2016, according to NASA analyses of ground-based observations and satellite data. Each of the first six months of 2016 set a record as the warmest respective month globally in the modern temperature record, which dates to 1880, according to scientists at NASA's Goddard Institute for Space Studies (GISS) in New York. The six-month period from January to June was also the planet's warmest half-year on record, with an average temperature 1.3 degrees Celsius (2.4 degrees Fahrenheit) warmer than the late nineteenth century.
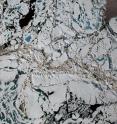
Five of the first six months of 2016 also set records for the smallest respective monthly Arctic sea ice extent since consistent satellite records began in 1979, according to analyses developed by scientists at NASA's Goddard Space Flight Center, in Greenbelt, Maryland. The one exception, March, recorded the second smallest extent for that month.
While these two key climate indicators have broken records in 2016, NASA scientists said it is more significant that global temperature and Arctic sea ice are continuing their decades-long trends of change. Both trends are ultimately driven by rising concentrations of heat-trapping carbon dioxide and other greenhouse gases in the atmosphere.
The extent of Arctic sea ice at the peak of the summer melt season now typically covers 40 percent less area than it did in the late 1970s and early 1980s. Arctic sea ice extent in September, the seasonal low point in the annual cycle, has been declining at a rate of 13.4 percent per decade.
"While the El Niño event in the tropical Pacific this winter gave a boost to global temperatures from October onwards, it is the underlying trend which is producing these record numbers," GISS Director Gavin Schmidt said.
Previous El Niño events have driven temperatures to what were then record levels, such as in 1998. But in 2016, even as the effects of the recent El Niño taper off, global temperatures have risen well beyond those of 18 years ago because of the overall warming that has taken place in that time.
The global trend in rising temperatures is outpaced by the regional warming in the Arctic, said Walt Meier, a sea ice scientist at NASA Goddard.
"It has been a record year so far for global temperatures, but the record high temperatures in the Arctic over the past six months have been even more extreme," Meier said. "This warmth as well as unusual weather patterns have led to the record low sea ice extents so far this year."
NASA tracks temperature and sea ice as part of its effort to understand the Earth as a system and to understand how Earth is changing. In addition to maintaining 19 Earth-observing space missions, NASA also sends researchers around the globe to investigate different facets of the planet at closer range. Right now, NASA researchers are working across the Arctic to better understand both the processes driving increased sea ice melt and the impacts of rising temperatures on Arctic ecosystems.
NASA's long-running Operation IceBridge campaign last week began a series of airborne measurements of melt ponds on the surface of the Arctic sea ice cap. Melt ponds are shallow pools of water that form as ice melts. Their darker surface can absorb more sunlight and accelerate the melting process. IceBridge is flying out of Barrow, Alaska, during sea ice melt season to capture melt pond observations at a scale never before achieved. Recent studies have found that the formation of melt ponds early in the summer is a good predictor of the yearly minimum sea ice extent in September.
"No one has ever, from a remote sensing standpoint, mapped the large-scale depth of melt ponds on sea ice," said Nathan Kurtz, IceBridge's project scientist and a sea ice researcher at NASA Goddard. "The information we'll collect is going to show how much water is retained in melt ponds and what kind of topography is needed on the sea ice to constrain them, which will help improve melt pond models."
Operation IceBridge is a NASA airborne mission that has been flying multiple campaigns at both poles each year since 2009, with a goal of maintaining critical continuity of observations of sea ice and the ice sheets of Greenland and Antarctica.
At the same time, NASA researchers began in earnest this year a nearly decade-long, multi-faceted field study of Arctic ecosystems in Alaska and Canada. The Arctic-Boreal Vulnerability Experiment (ABoVE) will study how forests, permafrost and other ecosystems are responding to rising temperatures in the Arctic, where climate change is unfolding faster than anywhere else on the planet.
ABoVE consists of dozens individual experiments that over years will study the region's changing forests, the cycle of carbon movement between the atmosphere and land, thawing permafrost, the relationship between fire and climate change, and more.
Source: NASA/Goddard Space Flight Center
Other sources
- Historical records miss a fifth of global warming: NASAfrom PhysorgFri, 22 Jul 2016, 9:51:15 UTC
- Historical Records Miss a Fifth of Global Warming: NASAfrom Science BlogFri, 22 Jul 2016, 1:11:07 UTC
- Historical records miss a fifth of global warming: NASAfrom Science DailyThu, 21 Jul 2016, 21:31:05 UTC
- Historical Records Miss a Fifth of Global Warming: NASAfrom NASA Jet Propulsion LaboratoryThu, 21 Jul 2016, 20:51:11 UTC
- Warming climate breaks records - againfrom CBSNews - ScienceTue, 19 Jul 2016, 22:41:04 UTC
- 2016 climate trends continue to break recordsfrom Science DailyTue, 19 Jul 2016, 19:31:34 UTC
- 2016 climate trends continue to break recordsfrom PhysorgTue, 19 Jul 2016, 19:31:13 UTC
- Record Breaking Temperatures Again in First Half of 2016 | Videofrom Live ScienceTue, 19 Jul 2016, 18:31:16 UTC
- Record Breaking Temperatures Again in First Half of 2016 | Videofrom Space.comTue, 19 Jul 2016, 18:31:15 UTC
- NASA Says 2016 Climate Trends Continue to Break Recordsfrom Science BlogTue, 19 Jul 2016, 18:01:06 UTC
- NASA Scientists to Discuss 2016 Climate Trends, Impactsfrom NASA Jet Propulsion LaboratoryMon, 18 Jul 2016, 18:31:22 UTC

