A stress meter for fault zones
For the first time, scientists from Rice University, the Carnegie Institution of Washington, and the U.S. Department of Energy's Lawrence Berkeley National Laboratory (Berkeley Lab) have measured — in the field rather than in the laboratory — how changes in stress in rocks affect changes in the speed of seismic waves at depths where earthquakes begin. The measurements could lead to a "stress meter" for better understanding how fault-zone stress is related to earthquakes. "The goal of our project was to develop a method for measuring stress changes, especially at depths where earthquakes originate," says Fenglin Niu of Rice University's Department of Earth Science. "We call it a seismic stress meter."
Niu is first author of the article reporting the research results, which appears in the 10 July issue of the journal Nature. Paul Silver of the Carnegie Institution of Washington's Department of Terrestrial Magnetism coordinated the project, and Tom Daley and Ernest Majer of Berkeley Lab's Earth Sciences Division provided the precision instruments which generated and detected the seismic waves.
"Over many years at Parkfield and other sites, Ernie Majer and I worked together to develop a suite of high-precision instruments for field work," says Daley. "One of our goals was to see if our existing cross-well instrumentation would have the sensitivity to measure the pressure changes and associated travel-time changes needed for this experiment."
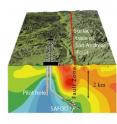
The research team used the twin boreholes ("wells") of the National Science Foundation's San Andreas Fault Observatory at Depth (SAFOD) near Parkfield, CA, to send signals from a source one kilometer deep in the pilot hole to a receiver at the same depth in the main hole. At that depth the two SAFOD boreholes are separated by only about five meters, and any change in travel time between them is measured in microseconds.
"The source is a stack of donut-shaped piezoelectric ceramic cylinders that expand when voltage is applied," Daley explains. "The source is suspended in the water that fills the hole, and when it expands it exerts pressure on the water, which exerts pressure on the rock; the seismic wave travels through the rock to the detector, which is in contact with the sides of the main bore hole and measures movement with accelerometers."
The instruments were sensitive enough to detect changes in rock stress a kilometer deep, caused only by changes in the barometric pressure of the atmosphere — a mere change in the weight of the air on the surface.
"To get the required sensitivity we did 'signal stacking,'" Daley says. "The source fires about four times a second, and we averaged every 45 minutes of data, to suppress random noise and to improve the signal-to-noise ratio. We collected this data continuously over two separate month-long periods."
During the first month of data collection the team found a consistent relationship between barometric pressure and minute changes in the travel time of seismic waves between the source and the detector. Higher barometric pressure (corresponding to greater stress on the rock) meant less travel time — the seismic waves moved faster because tiny cracks in the rock closed up under pressure.
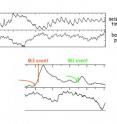
During the second month of data collection, the quality of the data actually improved, but the researchers detected two anomalous departures from the established relation of barometric pressure to travel time. These excursions corresponded to two earthquakes in the Parkfield region, an area so well instrumented that earthquake magnitude and location, including depth, can be determined with great precision. One earthquake measured magnitude 3, the largest local event during the observation period; the other earthquake measured magnitude 1, but occurred closer to the experiment.
The excursions in the travel-time data began 10 hours before the magnitude 3 event and 2 hours before the magnitude 1 event. In earlier, laboratory-based studies of the relationship of seismic-wave travel times and stress, such "preseismic" changes were related to changes in the properties of microcracks in the rock.
"The same may be the case here," says Daley. "But in fact we do not have a clear physical explanation for these preseismic observations as yet, although they plausibly represent stress changes in the crust. Our goal is to determine if they are repeatable and, if so, to determine the ultimate physical basis. Nevertheless, what we've seen are interesting stress changes associated with earthquakes. It encourages us to continue this kind of observation."
Says Rice's Fenglin Niu, "Detecting a preseismic velocity change is at best only a small step toward reliable earthquake prediction. Before we can supply any useful information before an earthquake, we will need a physical model that can explain when such a velocity change would occur before a quake."
Source: DOE/Lawrence Berkeley National Laboratory
Articles on the same topic
- Pre-earthquake changes detected in the crustWed, 9 Jul 2008, 17:35:59 UTC
Other sources
- Pre-quake seismic wave changes discoveredfrom UPIWed, 9 Jul 2008, 21:35:19 UTC
- Promise For Predicting Earthquakes: Pre-earthquake Changes Detected In Crustfrom Science DailyWed, 9 Jul 2008, 19:21:17 UTC
- Pre-quake changes seen in rocksfrom BBC News: Science & NatureWed, 9 Jul 2008, 17:14:18 UTC

